
Point In Time Inventory Cost Tracking
Written by Jeff Geiger
Problem:
In JD Edwards EnterpriseOne and OneWorld, you cannot easily track the changes in costs (F4105), cost factors (F30026) and inventory levels (F41021) over time. This is useful when doing inventory trend analysis on cost and value.
Solution:
One way to accomplish some of this is to perform “As Of” processing, using standard JD Edwards functionality to accomplish summarizing the As Of inventory value by item, location, serial, etc. within a monthly bucket. Two drawbacks are: it is difficult to get the As Of processing in the file to tie out to reality, and it is based on the CARDEX. In order to build, you need to run a batch program that populates the As Of file that marks records in the CARDEX as processed. To reprocess, you need to pick a point in time, reset the flags and rerun the batch. Frankly, it is just plain difficult to report on.
Another method to get you the point in time valuation of inventory is to use inventory valuation reports that come standard with JD Edwards, and schedule them to run at certain points in time that correspond with the frequency you want to see the values. Run both a PDF and CSV (comma delimited file) version for each UBE. You can then import the data from the CSV or PDF into an Excel spreadsheet and do trend analysis there. If you know anything about PDFs or CSVs, you know that this is a more manual approach and it would require the discipline of the person combining the information to know exactly what they are doing, and they must do it in a timely manner.
What we really need is a point-in-time report that can show us inventory values as of a certain date that gives the level of detail that the Item Cost, Item Cost Components and Item Location can provide, and can show us trend data across a 12-month or multi-year period of time.
To accomplish this, you must first create tables based on the Item Cost, Cost Factors and Item Location file. There may be special conditions that require you to create other tables, such as the serial numbers table, item master, item branch, etc., but for this example, we are doing only the simplest. You can choose to expand up or down as you see fit. Remember, the more tables you choose, the more disk space you chew up when storing your information. Talk to your CNC professional about creating a separate data server if disk space is a problem. This can be a Microsoft platform server with lots of disk space, giving you big bang for your buck, since it is really only used for data storage.
The files you create are to be exact copies of the original tables, however, you need to add additional values to the keys. The key values you want to add depend on the frequency you will be creating the data copy. If you need to do a weekly capture, you would create a field for Century, Year and Week (1- 52). If you wanted only monthly, you would create a field for Century, Year and Month (1-12). You could also model it after the accounting periods, and place the 52-week accounting bucket field into the table. In fact, you could take daily snapshots of the data if you wanted, but that would really eat up a lot of disk and would provide limited insight, while monthly usually is about the right time frame.
Once you have created the files, you will need to generate them and create a UBE, or multiple UBEs, that populate them with the information currently in the table. This may be more efficient by creating RPG or SQL to perform this task, however, the additional key fields will need to be filled programmatically, and become cumbersome when using SQL. RPG is only available if you are on the AS/400. Another programming platform such as VB Script could be used, but wouldn’t be much more efficient than writing a UBE, and most JD Edwards installations have some UBE talent in house. In the monthly example below, we information about two different items over a three-month period of time:


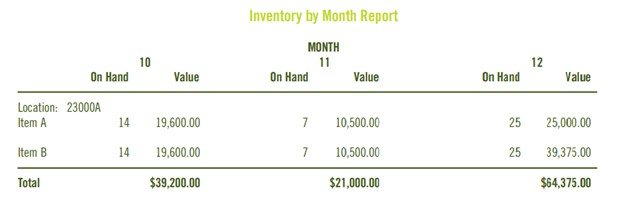
This is just a simple example of a report that you could create. Any way you can think of slicing and dicing the data can be done, because you’ve taken periodic snapshots of your data.
Creating this and a handful of other simple reports, along with writing the programs that back up the data, should take no more than one week of work from a talented developer. The more complicated your reporting needs and the more complicated the snapshots, the more time it will take. This is a quick ROI project that should be implemented as soon as possible during the project so the history begins to build. Until you write and schedule the jobs to capture the data (priority number one!), you will have no historical data.
Some important things to consider are: how often you wish to take a snapshot, how much disk space is required and how much are you going to keep over what period of time. To keep the data cleaned up, merely write a program to purge data older than a particular century, year and month. You could keep the past three years as monthly snapshots, and only yearly or quarterly snapshots beyond that. It is really up to your needs.
Finally, you will also need to have a job scheduler run this program. It will need to be able to calculate century, year and month, or you will need to pass them in as processing options that a user sets before the job is run. The job will need to be run at a point in time that corresponds with the company’s financial periods. Otherwise, this information cannot be used to tie out to the financial records.